Student's t-test
Statistical test for comparing group means using t-distribution.

Student's t-test is a statistical hypothesis test used to determine whether the difference between the responses of two groups is statistically significant. It is most commonly applied when the test statistic follows a normal distribution if a scaling term were known, but that term is estimated from the data, causing the test statistic to follow a Student's t-distribution under certain conditions. The test is widely used to compare the means of two populations.
- field
- Statistics
- known_for
- Developing the t-test and the t-distribution
- associated_people
- William Sealy Gosset (pseudonym 'Student'), Ronald Fisher, Karl Pearson
Lore & Background
Gosset worked at the Guinness Brewery in Dublin, Ireland, and was interested in small sample problems, such as the chemical properties of barley.
Reader's Guide
Student's t-test remains a foundational tool in statistics, particularly for hypothesis testing with small sample sizes. Its development by William Sealy Gosset under the pseudonym 'Student' allowed Guinness to monitor stout quality economically without revealing their methods to competitors. The test's significance lies in its ability to handle unknown scaling terms by using the sample standard deviation, making it practical when population parameters are unknown. Although the t-test converges to the Z-test as sample size increases, it is essential for small datasets. The work of Ronald Fisher later popularized the distribution and test, cementing their place in statistical practice. The test has multiple forms—one-sample, two-sample independent, and paired—each with specific assumptions about normality and variance. Its legacy endures in fields from medicine to manufacturing, where comparing group means is fundamental.
Did You Know?
- The 't' in t-statistic comes from 'Student's t-distribution', not from 'hypothesis test statistic'.
- Gosset used the pseudonym 'Student' because his employer preferred staff to use pen names when publishing scientific papers.
- A paired samples t-test has n − 1 degrees of freedom, where n is the number of pairs (i.e., the number of differences).
Origins on the Brewery Floor
The story of the t-test begins not in a university lecture hall but on the production floors of the Guinness Brewery in Dublin, Ireland. William Sealy Gosset, an employee of the company, faced a practical problem: assessing the chemical properties of barley and monitoring the quality of stout using only small sample sizes. The standard statistical tools of his era assumed large datasets, which simply weren't available in a brewery setting. Gosset needed a method that could draw meaningful conclusions from limited observations, and he developed what would become the t-test as an economical way to track the quality of the stout being produced. When he submitted his work to the scientific journal Biometrika, his employer's policy required staff to publish under pen names. A second, more speculative explanation for the name suggests that Guinness wanted to keep competitors from learning they were using this new statistical tool to evaluate raw materials. Either way, the pseudonym stuck, and the test became permanently associated with the name "Student" rather than its true creator.
Mathematical Lineage and the t-Distribution
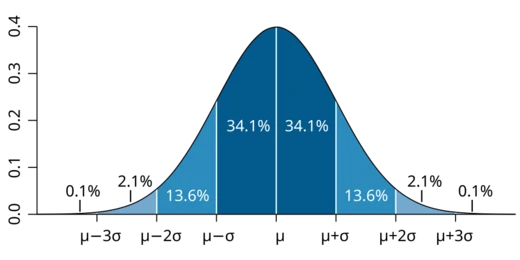
Gosset's contribution was to publish the distribution in English and connect it to the practical problem of hypothesis testing with unknown scaling parameters. The core idea is this: when you compute a test statistic that would follow a normal distribution if a certain scaling term were known, but that term must instead be estimated from the data itself, the resulting statistic follows a t-distribution under the null hypothesis. This makes the t-test particularly useful in situations where the true population standard deviation is unknown, a nearly universal condition in real-world data. As sample sizes grow, the t-distribution converges toward the normal distribution, meaning a Z-test and a t-test produce increasingly similar results with larger datasets. The one-sample version uses n minus 1 degrees of freedom, and while the parent population need not be perfectly normal, the distribution of sample means is assumed to be approximately normal, a condition supported by the central limit theorem when observations are independent and the second moment exists.
Practical Variants and Applications
The t-test family branches into several forms depending on the research question. The one-sample version asks whether a single population's mean equals a specified value, computing a statistic from the sample mean, sample standard deviation, and sample size. The two-sample version, far more common in practice, tests whether the means of two populations differ significantly. These two-sample tests come in two flavors: independent (unpaired) samples, where two separate groups are compared, such as 50 subjects receiving a treatment and 50 serving as controls, and paired samples, where measurements are taken on the same units under two conditions. Paired tests function as a form of blocking, offering greater statistical power, meaning a lower probability of a false negative, when the paired units share similar noise factors unrelated to group membership. In observational studies, pairing can help reduce the influence of confounding variables. Strictly speaking, the name "Student's t-test" applies when the two populations are assumed to have equal variances; when that assumption is relaxed, the resulting procedure is more properly called Welch's t-test, though in everyday usage both are often lumped together under the Student's label.
Fisher's Role and Enduring Legacy
Although Gosset invented the test, the name "Student's t-test" and "Student's distribution" owe their widespread recognition largely to Ronald Fisher. Fisher's work in popularizing and formalizing the distribution cemented the association between the pseudonym and the statistical tool in the minds of researchers worldwide. During that time, his identity was known to fellow statisticians and to Pearson himself, who served as editor-in-chief of Biometrika. Despite this professional recognition, the public-facing credit went to "Student." The term "t-statistic" itself is simply an abbreviation of "hypothesis test statistic." Over the decades, the t-test has become one of the most widely applied tools in science, medicine, and industry, prized for its ability to draw inferences from small samples where normal-theory methods would be unreliable. Its convergence to the Z-test as data accumulate also gives researchers confidence that the method remains valid across a wide range of sample sizes.
More in Probability And Stochastic Processes 1-21
Spotted an error? Know more?
This is a living reference — every entry is fact-audited, and reader corrections feed straight into our audit queue. Suggest an edit · See this site's audit record